Three signals.
One
language.
observe
Punk::Observe receives OpenTelemetry, stores it, queries it and draws it. Traces, metrics and logs land in a storage engine built for each signal’s shape, and one query language spans all three - so a spike, the traces that caused it and the lines those traces logged are one expression, not three tabs and a copied trace id.
It mounts into an application you already have, as a plugin, under a guard you control.
use Punk::Plugin::Observe;

plugin 'Observe' => {
    guard  => 'Web::Auth#observe_admin',   # required, like Queue's
    store  => '/var/lib/punk-observe',
    ingest => { prefix => '/v1', keys => '/etc/punk-observe/keys' },
    limits => { series => 1_000_000, rate_records => 50_000 },
};
The whole point
Three stages re-key the stream, and they are the reason this is one
language rather than three sharing a prompt box. A source, then stages;
every stage takes rows and returns rows, so where,
by and count are one implementation each. The
signals differ only in which columns exist.
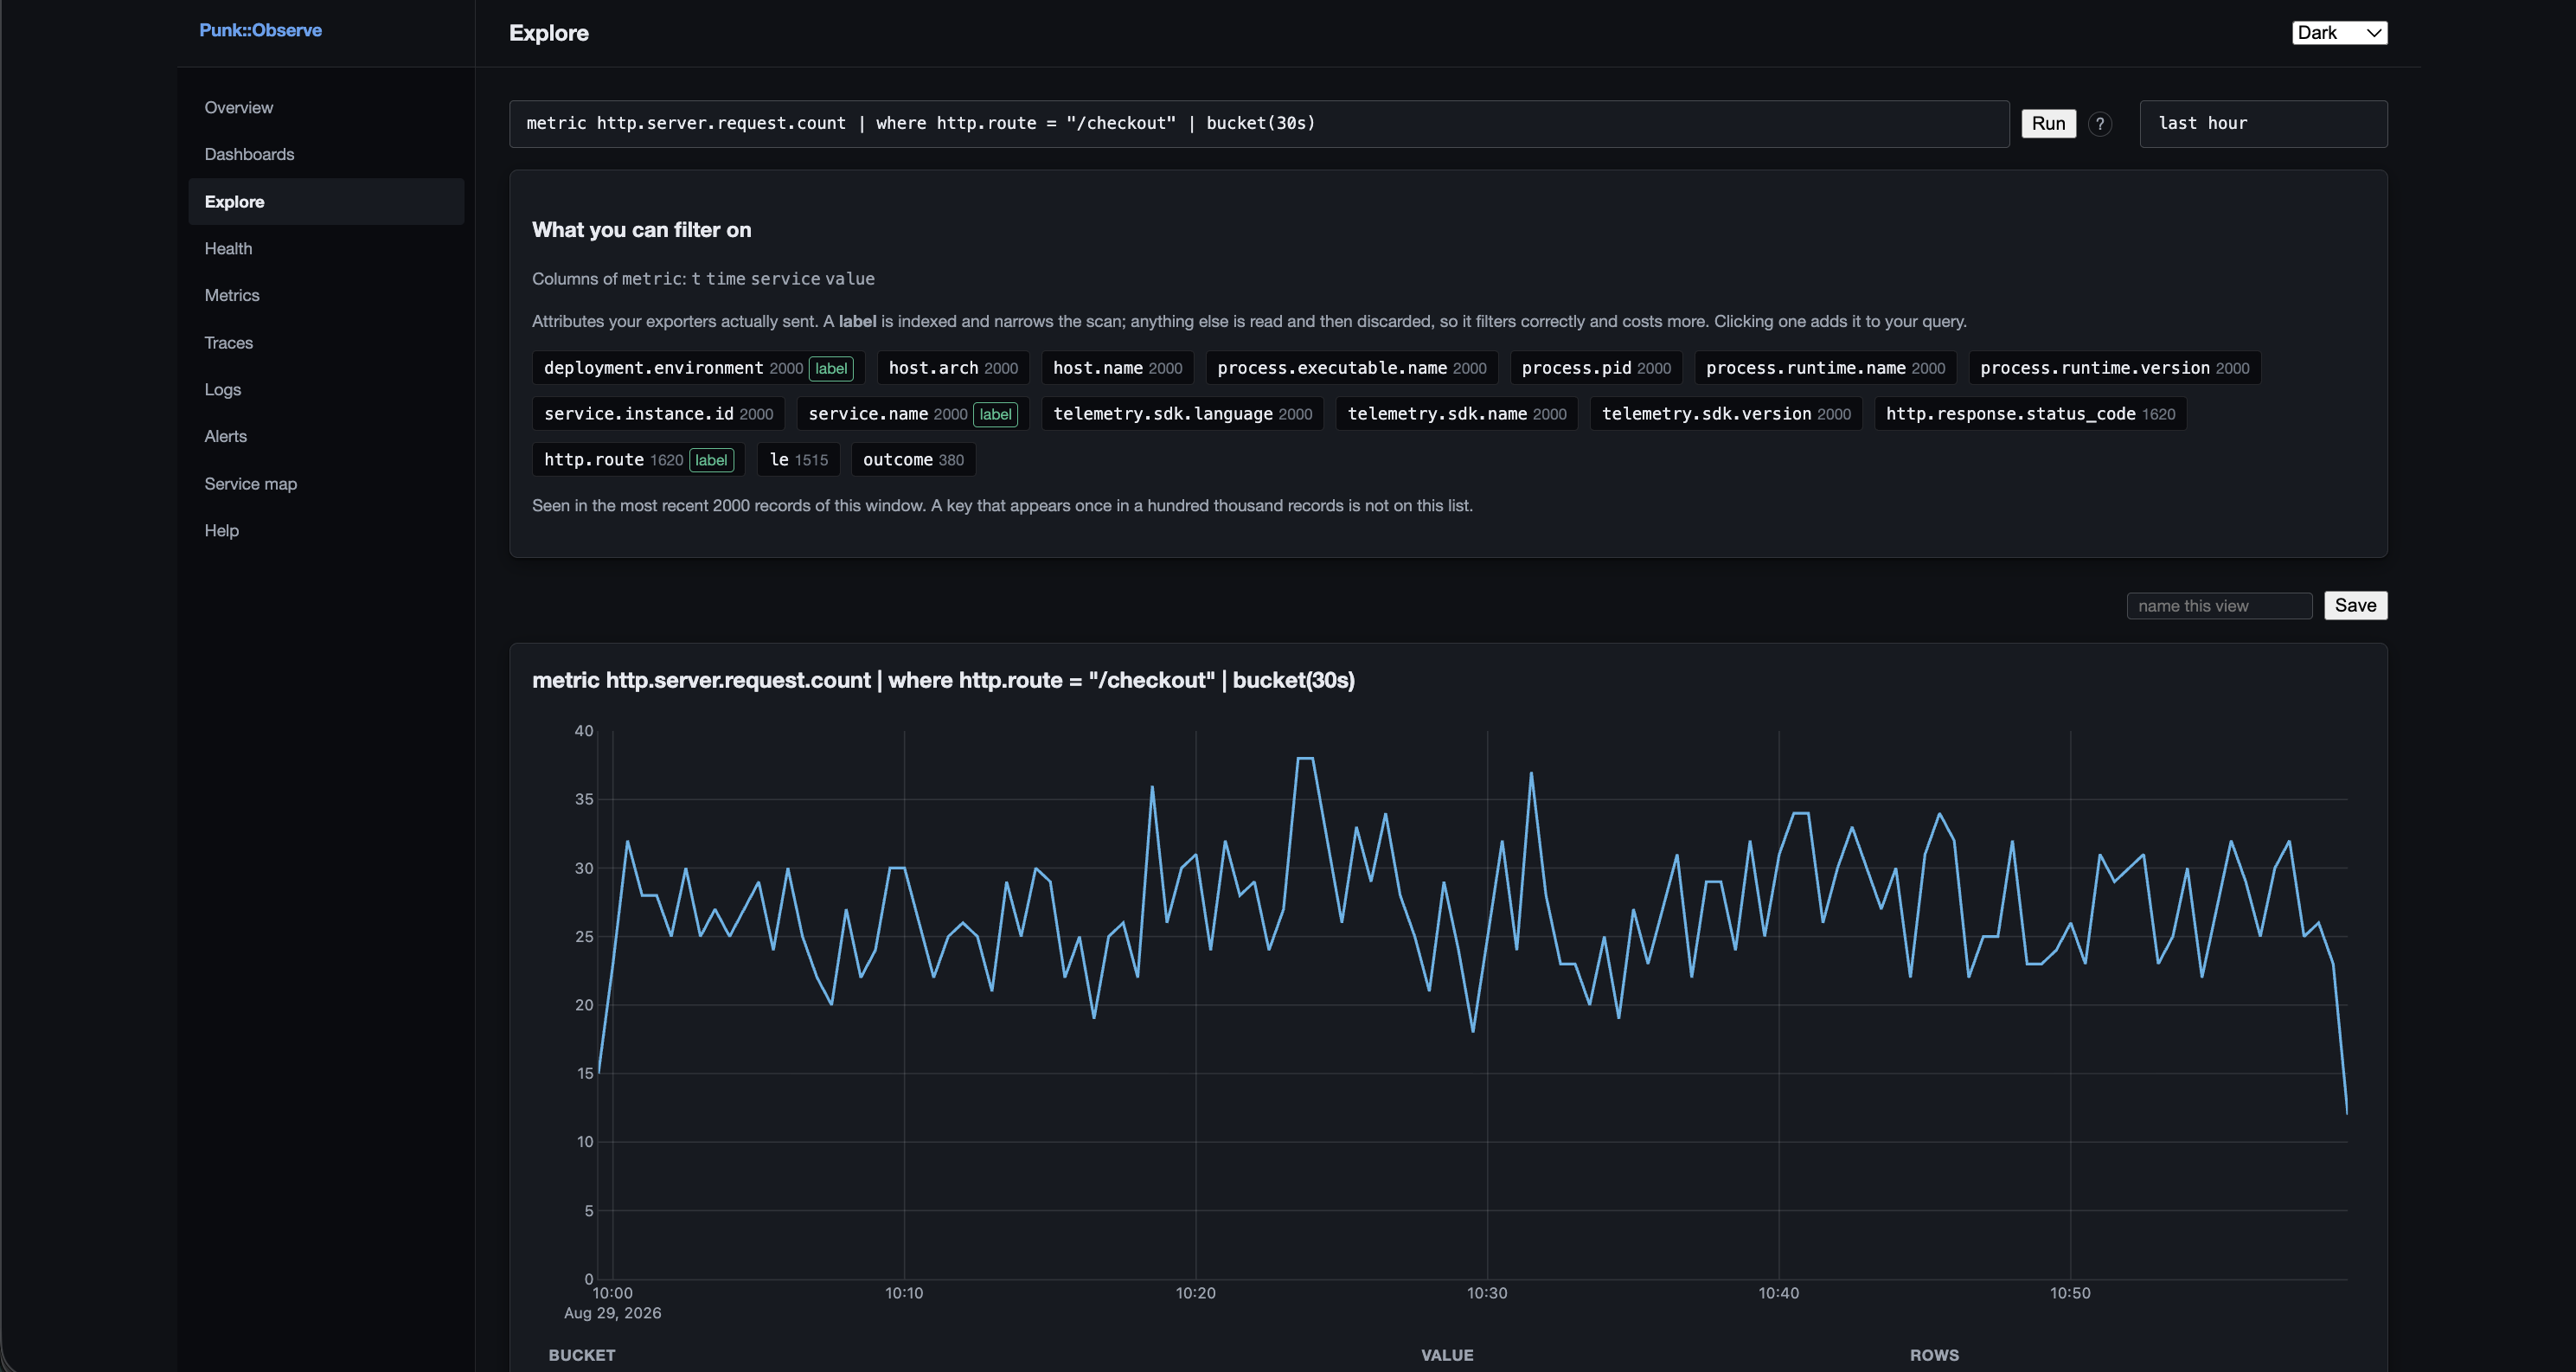
metric http.server.request.count | where http.route = "/checkout" | bucket(5m) p99
  | exemplars     # the trace ids recorded alongside the spike
  | traces        # those traces, in full
  | logs          # every log line correlated by trace_id
| traces needs a trace identifier on its rows. Logs and
spans already have one; a metric stream does not, which is what
| exemplars is for - it re-keys the stream onto the trace ids
recorded alongside the points. So metric x | traces is a parse
error, and the error tells you to add | exemplars first. It is
the feature, so it is discoverable by typing rather than by reading a
manual.
What you get
-
OTLP ingest
http/protobufandhttp/json, gzip and deflate bodies, partial success with the rejected count named, and a tenant resolver. Any OpenTelemetry SDK in any language points at it with two environment variables. -
A storage engine per signal
A write-ahead log, immutable segments with content-derived series ids, compressed metric chunks, deflated log blocks behind a trigram filter, and spans assembled at read time. No TSDB to run beside it.
-
The screens
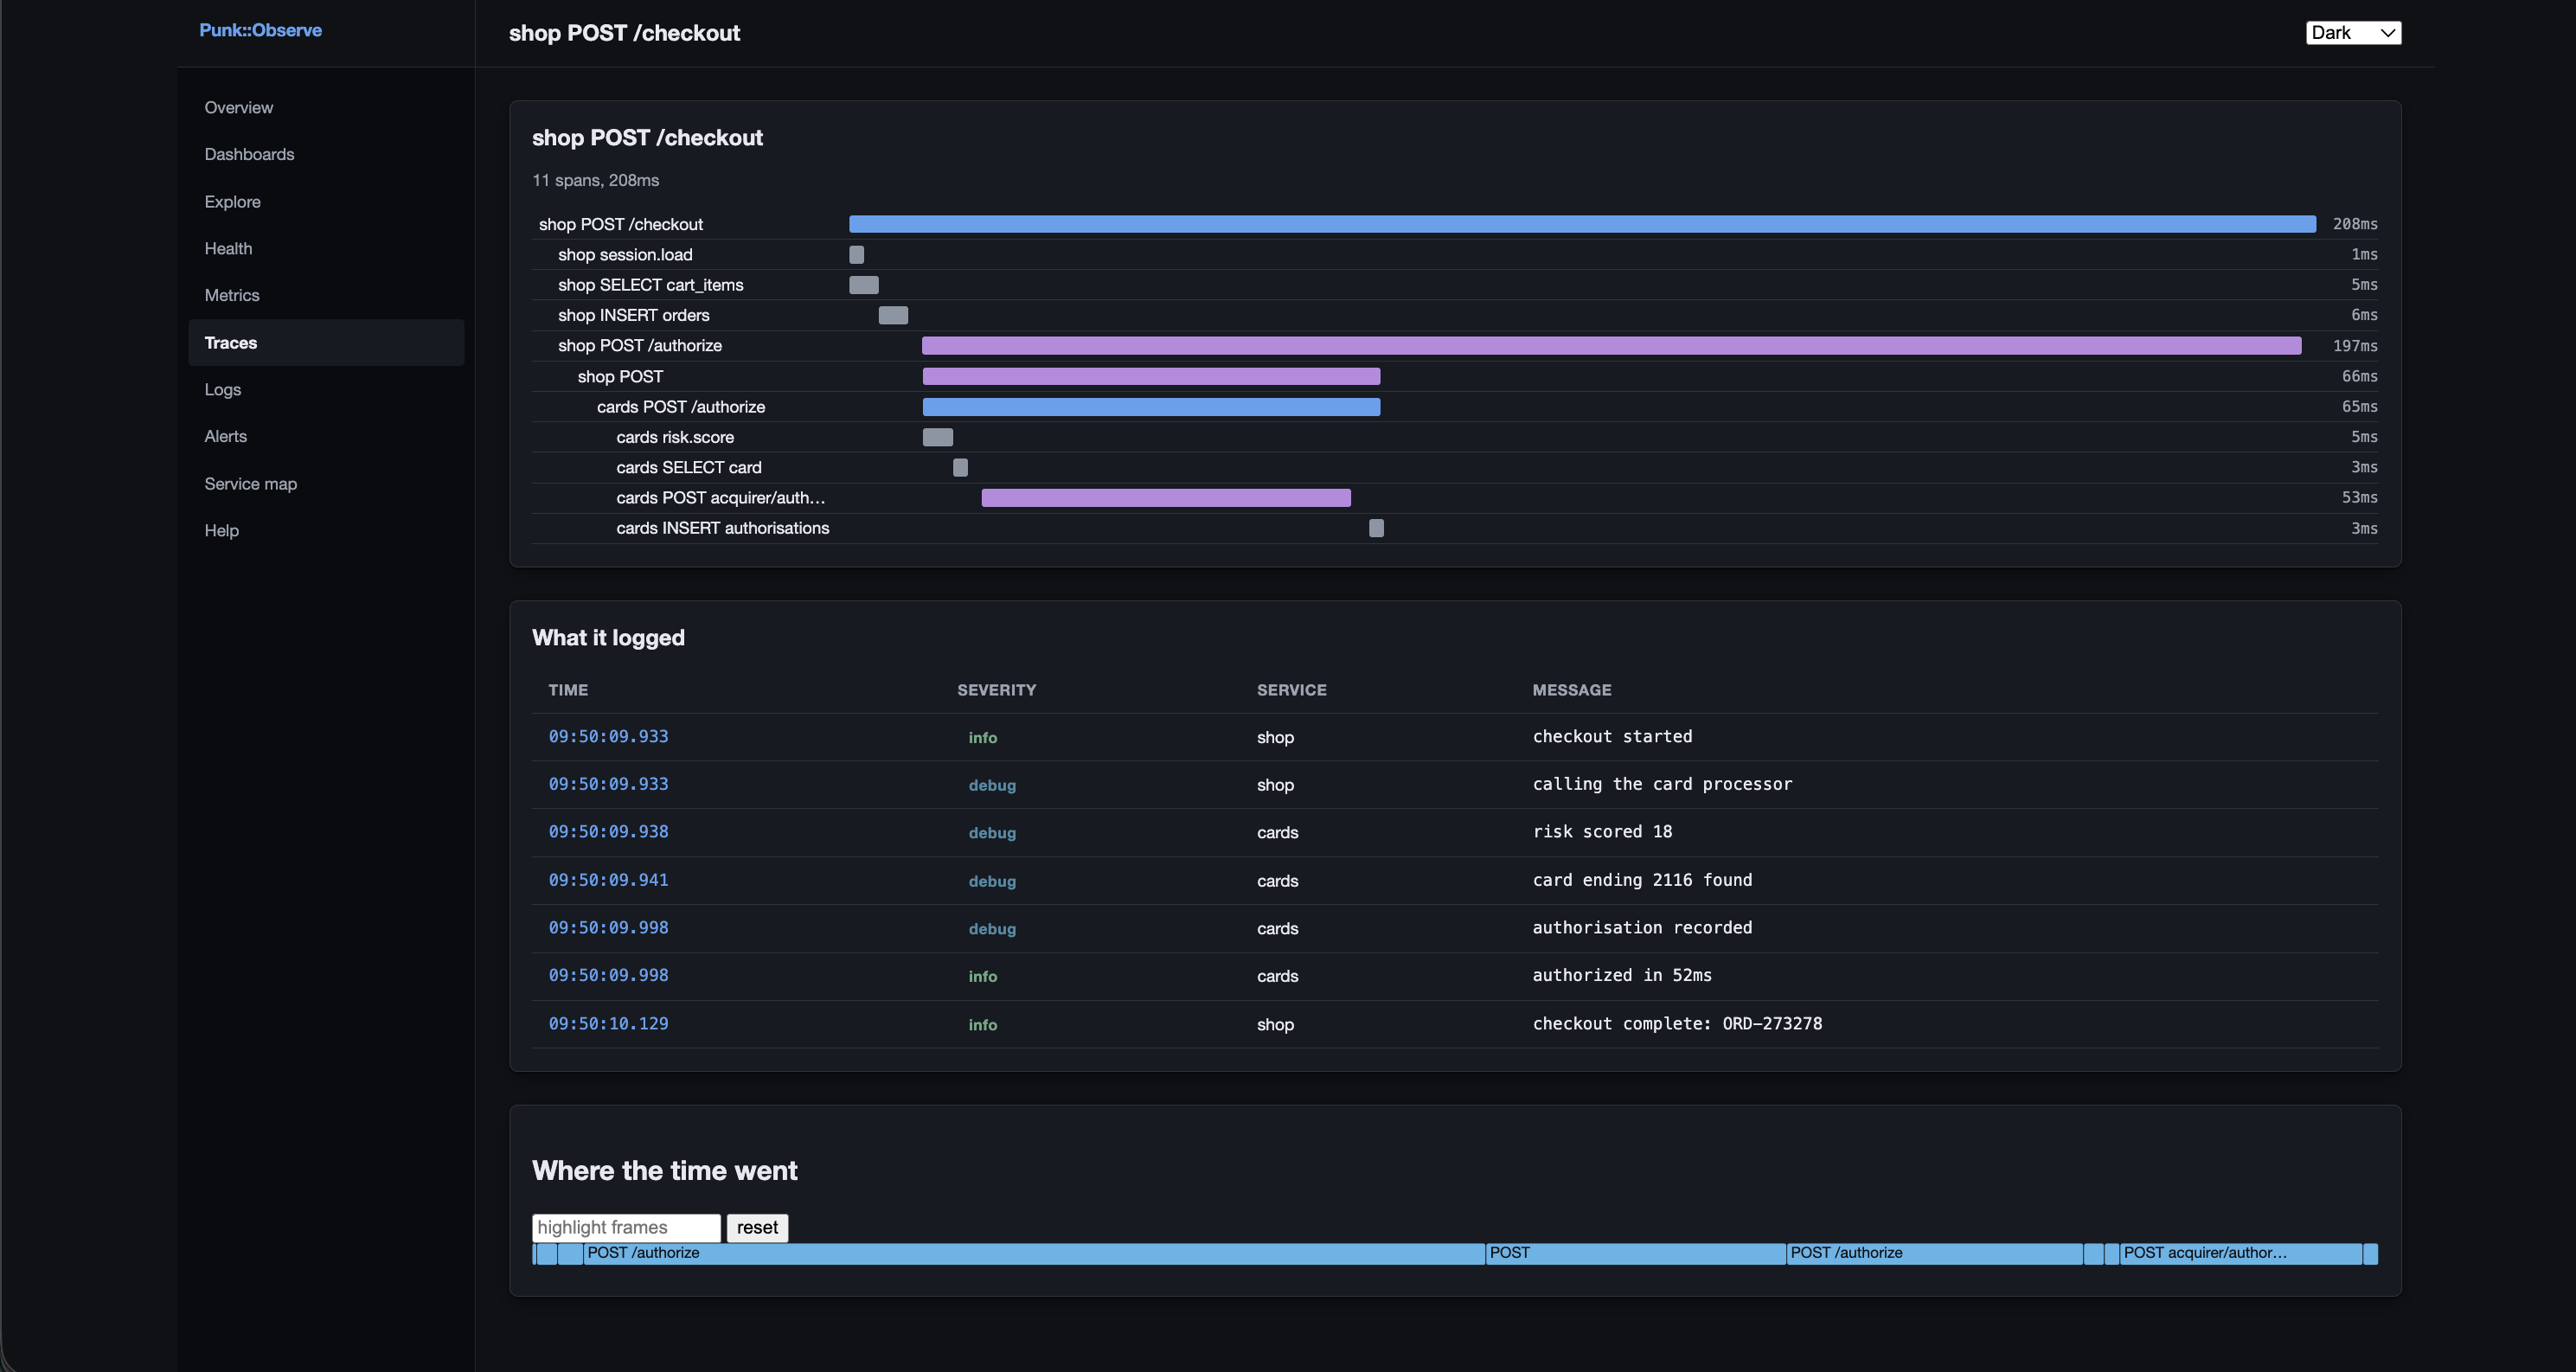
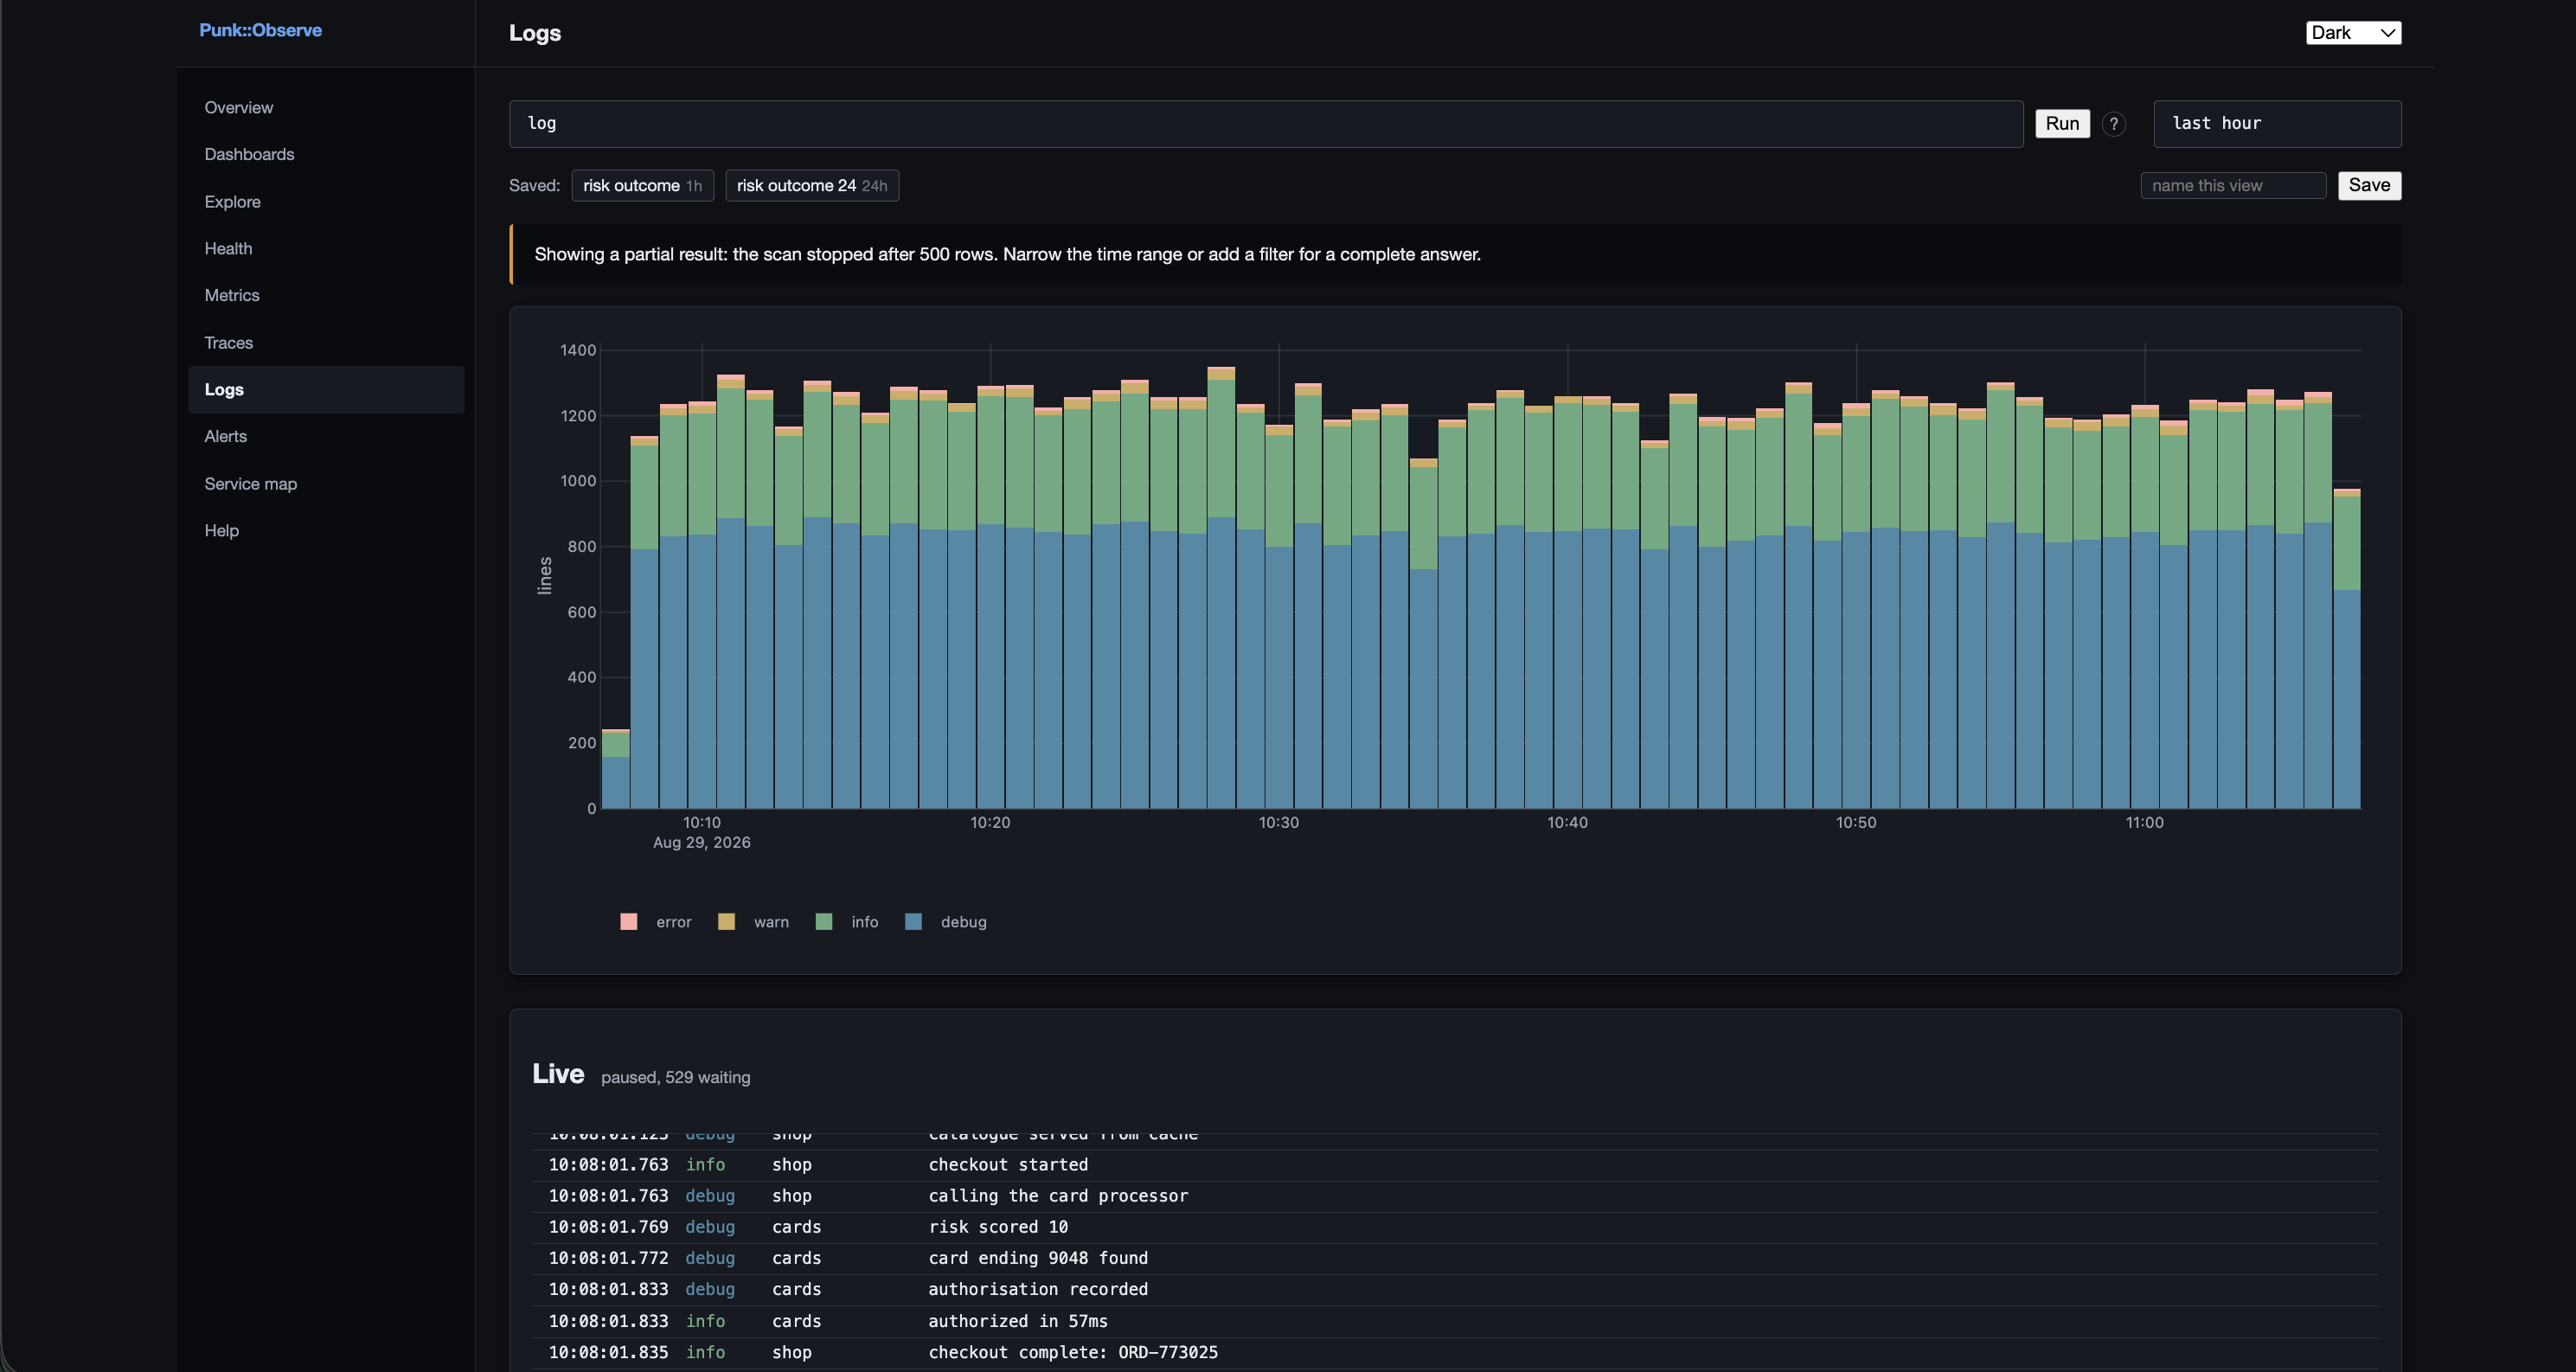
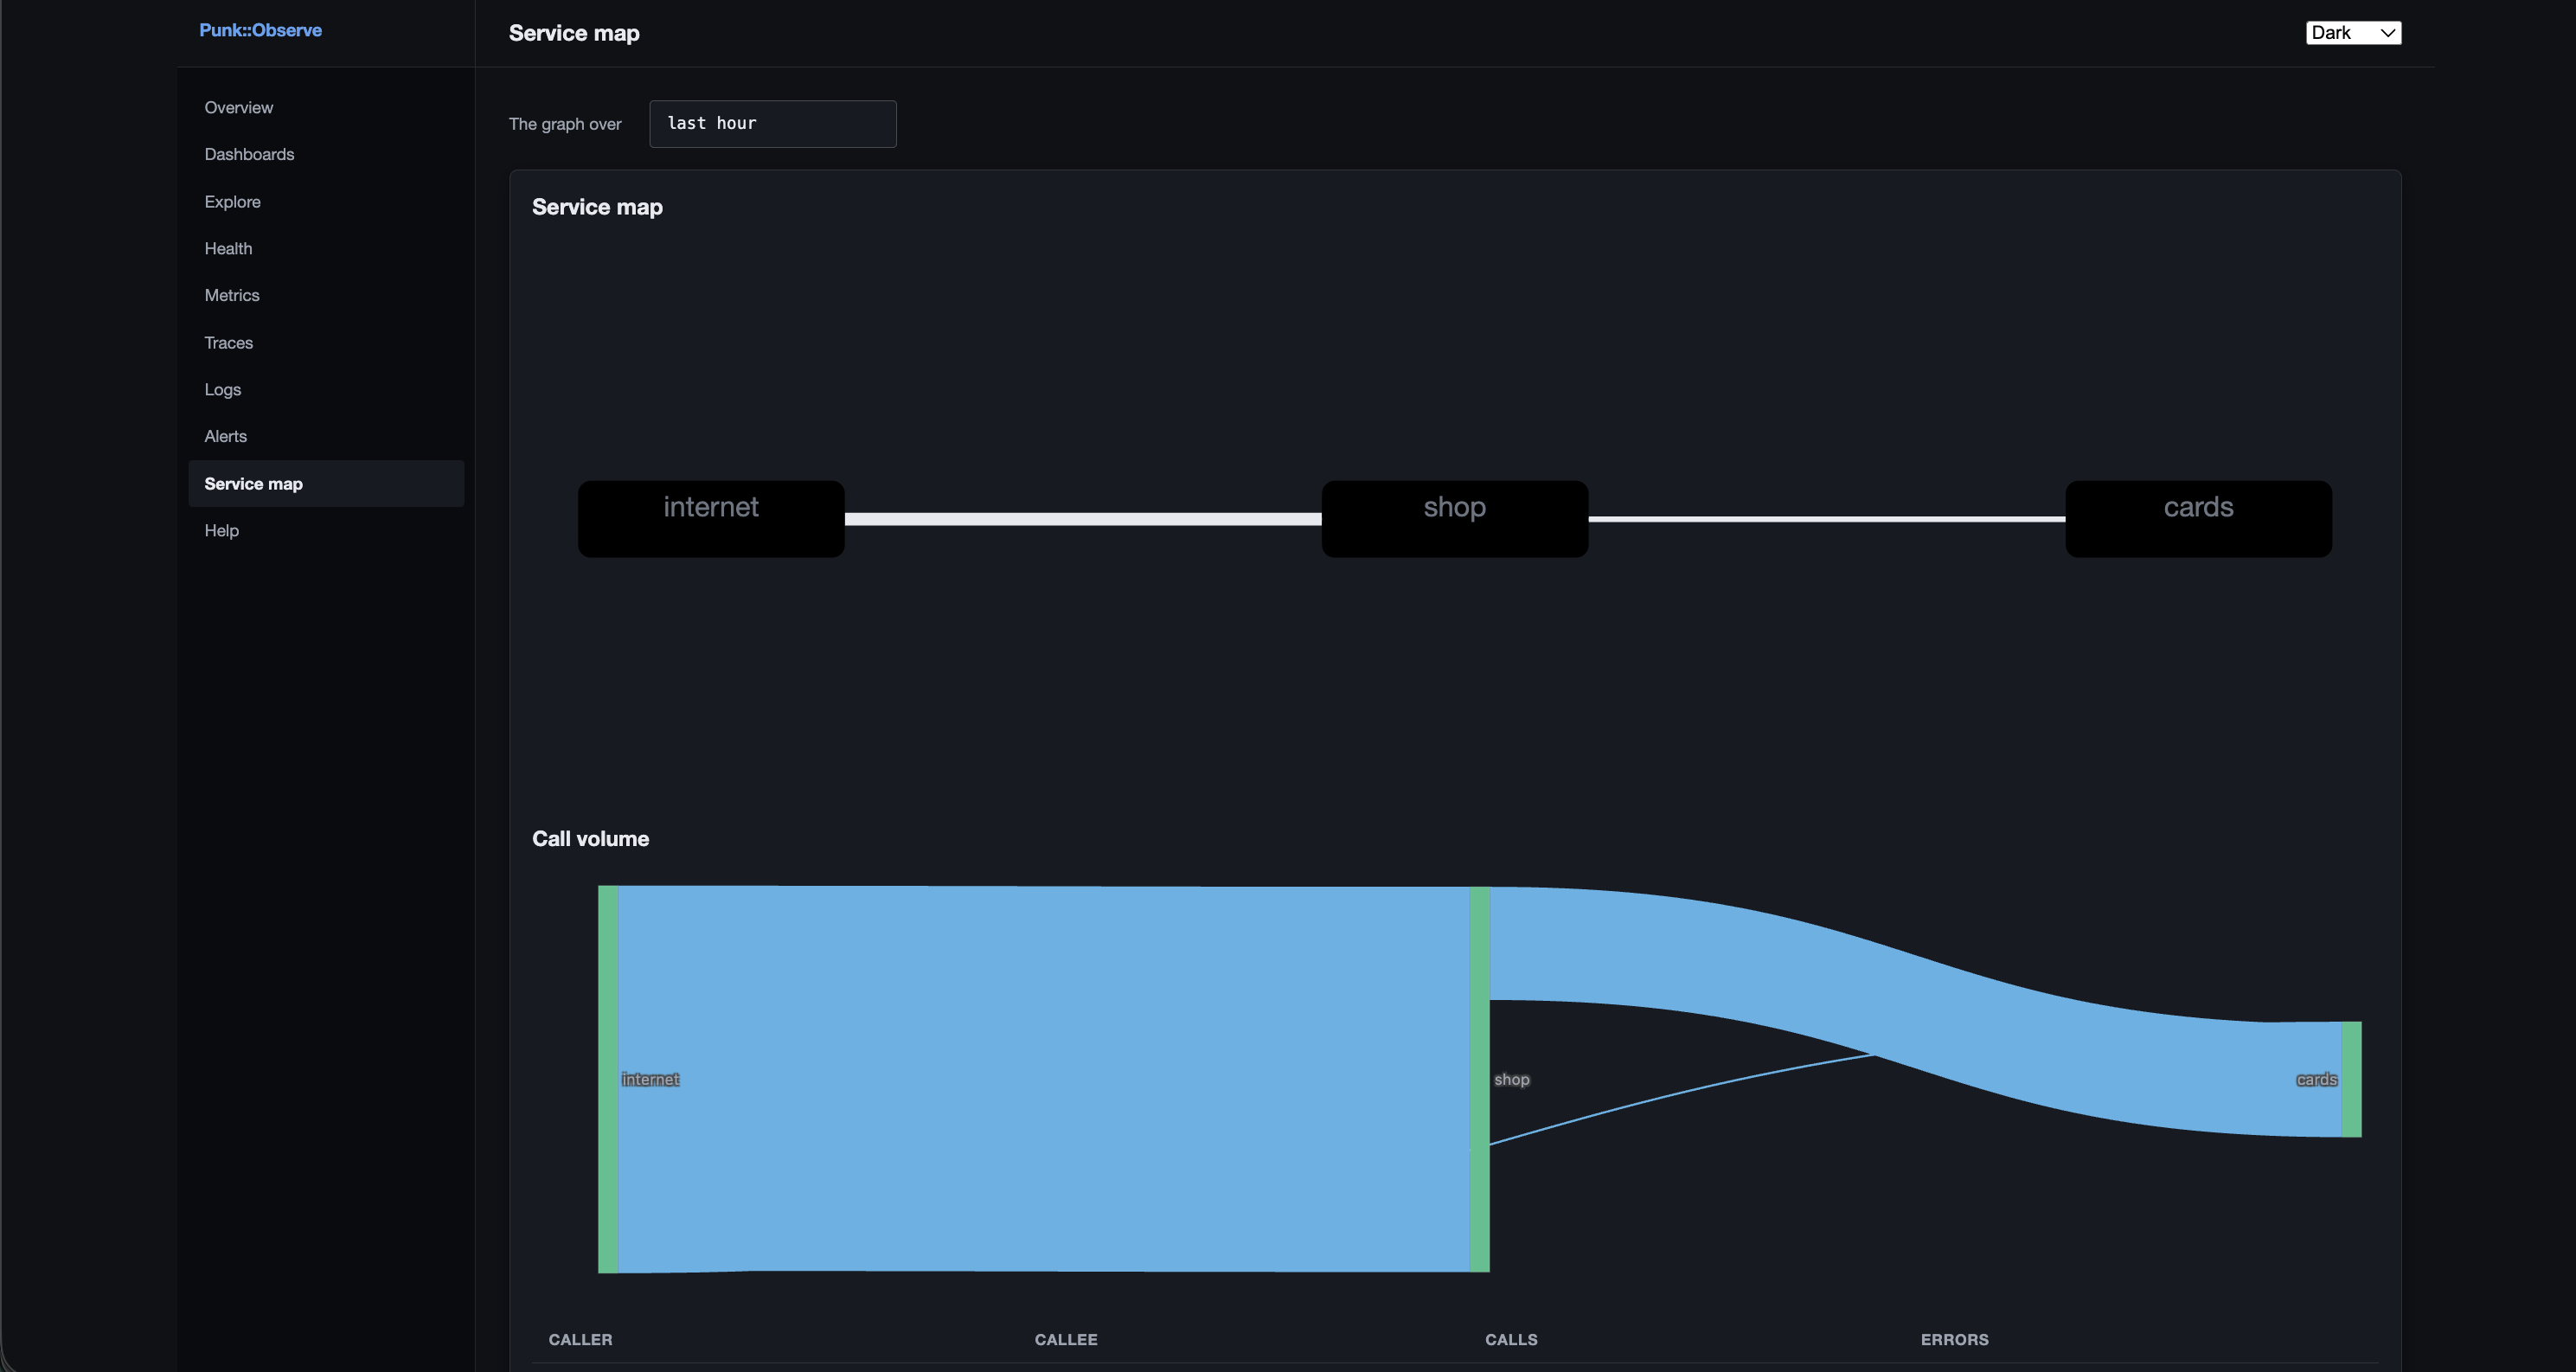
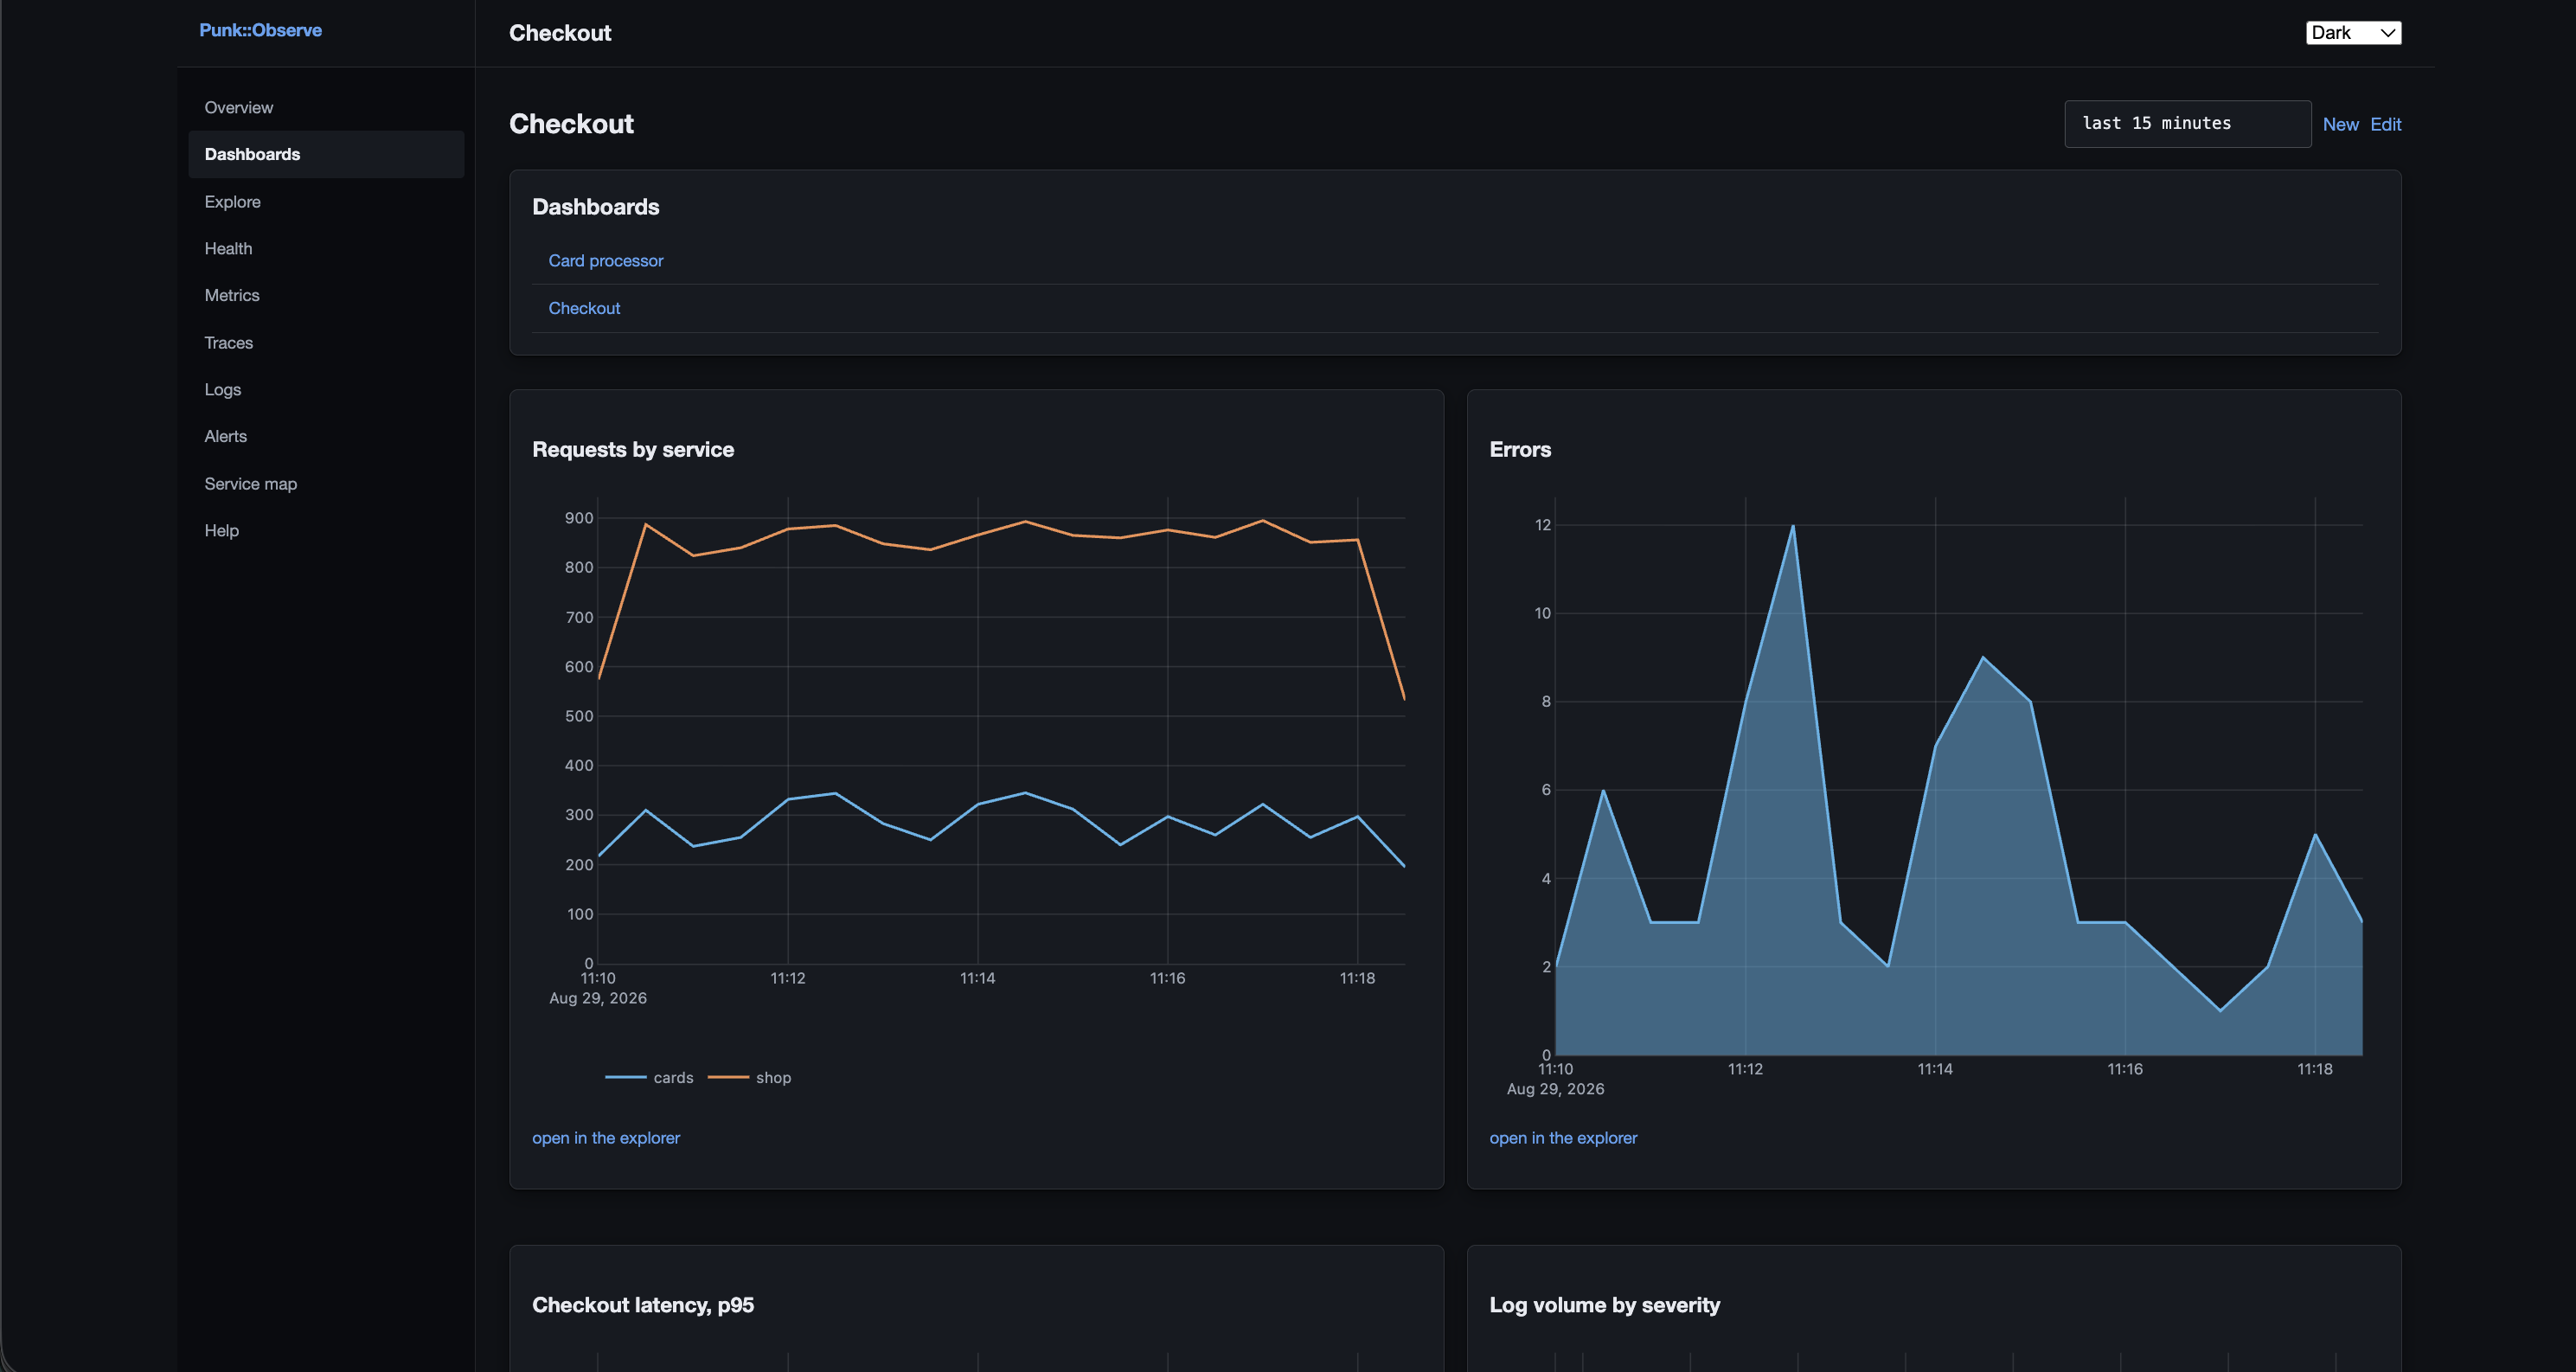
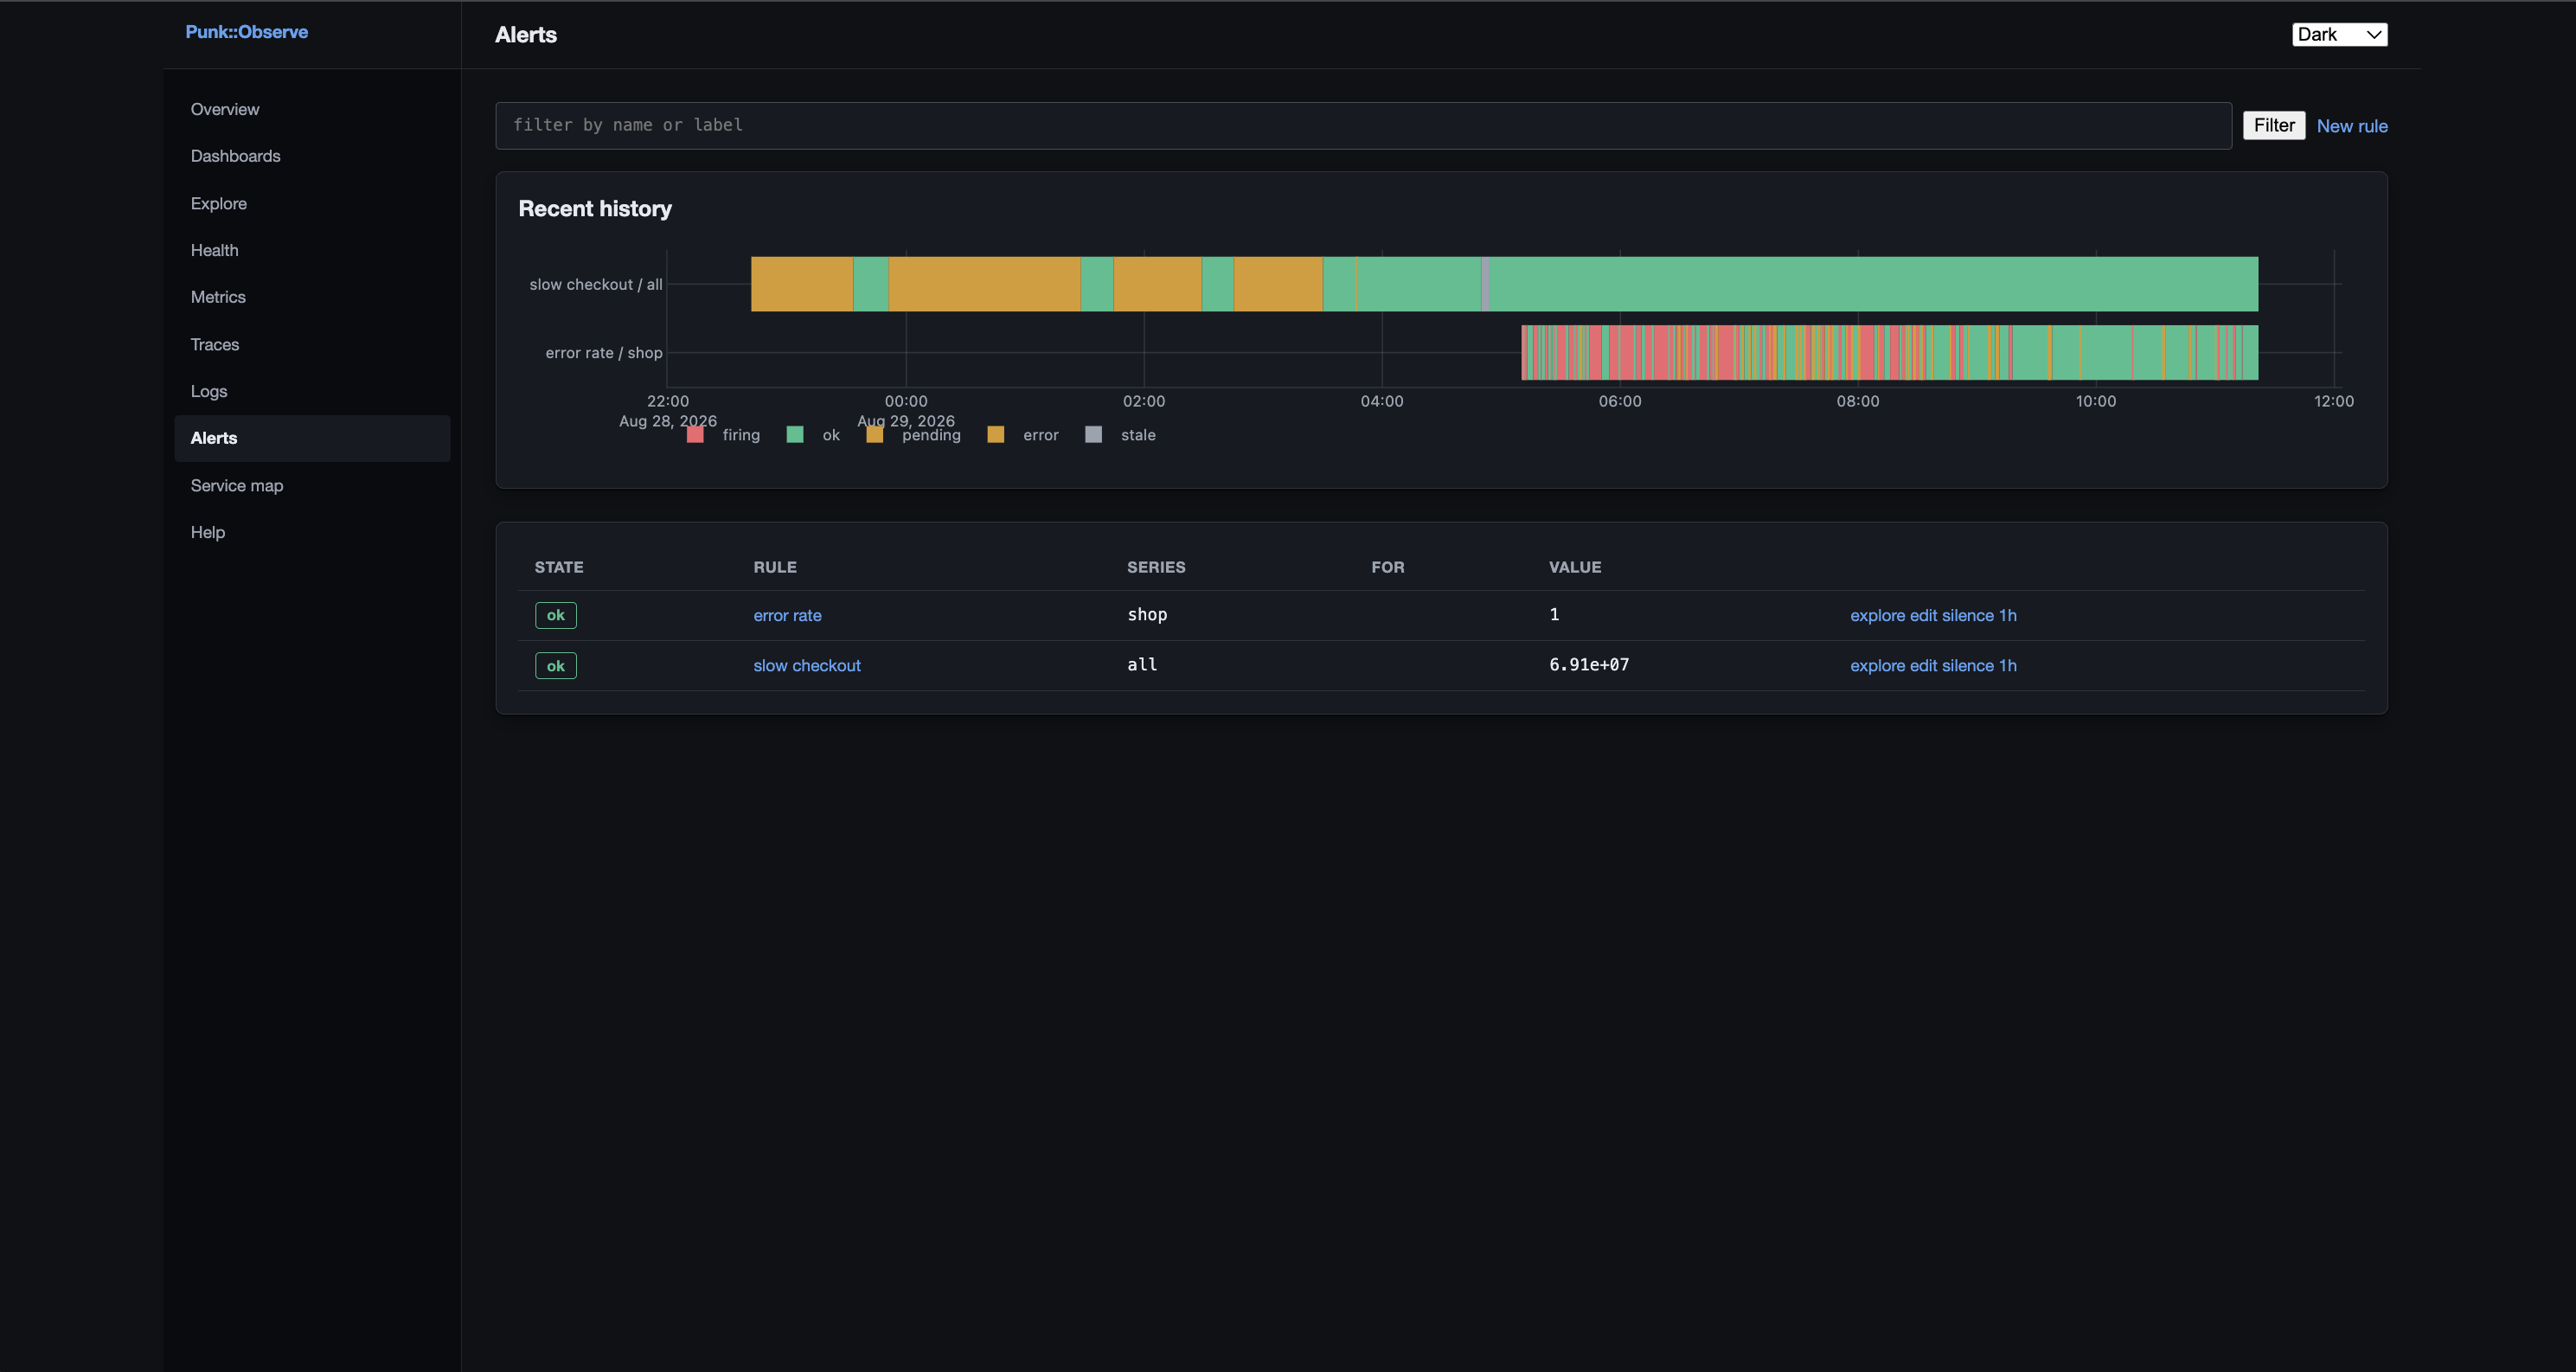
Status, logs, metrics, traces, the service map, explore, dashboards and alerts. The waterfall, the flamegraph and the service map are laid out in C and arrive complete in the HTML.
-
Live tail
Over server-sent events, across a whole worker pool - the log stream that is actually arriving, not a page you refresh.
-
Dashboards and alerting
Saved panels, validated by the same parser that runs them. Per-series rule state through ok, pending and firing, grouped notification, and an SSRF-checked webhook target.
-
Retention that is not a cliff
Compaction, two rollup tiers, and deletion by whole block. A byte budget over the window shortens retention rather than refusing writes: you lose old data, never the incident happening now.
-
Cardinality that cannot run away
A hard series cap with a named overflow bucket, counted in a shared arena so it is exact across the pool - and an indexed-attribute allowlist, so one service putting a user id in a resource attribute cannot take the store down.
-
Guarded, like the rest
The UI is an
underscope, so the guard covers routes added later too, and registration croaks without one. Ingest is authenticated by key instead, because an exporter has no session - and an ingest key cannot read the UI.
Sending it something
The receiver speaks the protocol the SDKs already speak, so there is nothing to instrument twice and no collector in the middle. An application already exporting through the OpenTelemetry Collector points that here as one more OTLP endpoint.
From Perl, Punk::OpenTelemetry is the client half and has had nowhere to export to since its first release. This is where.
# Any OpenTelemetry SDK, in any language, points at it the same way.
export OTEL_EXPORTER_OTLP_ENDPOINT=https://myapp.example/v1
export OTEL_EXPORTER_OTLP_PROTOCOL=http/protobuf
export OTEL_EXPORTER_OTLP_HEADERS="Authorization=Bearer $INGEST_KEY"
The screens
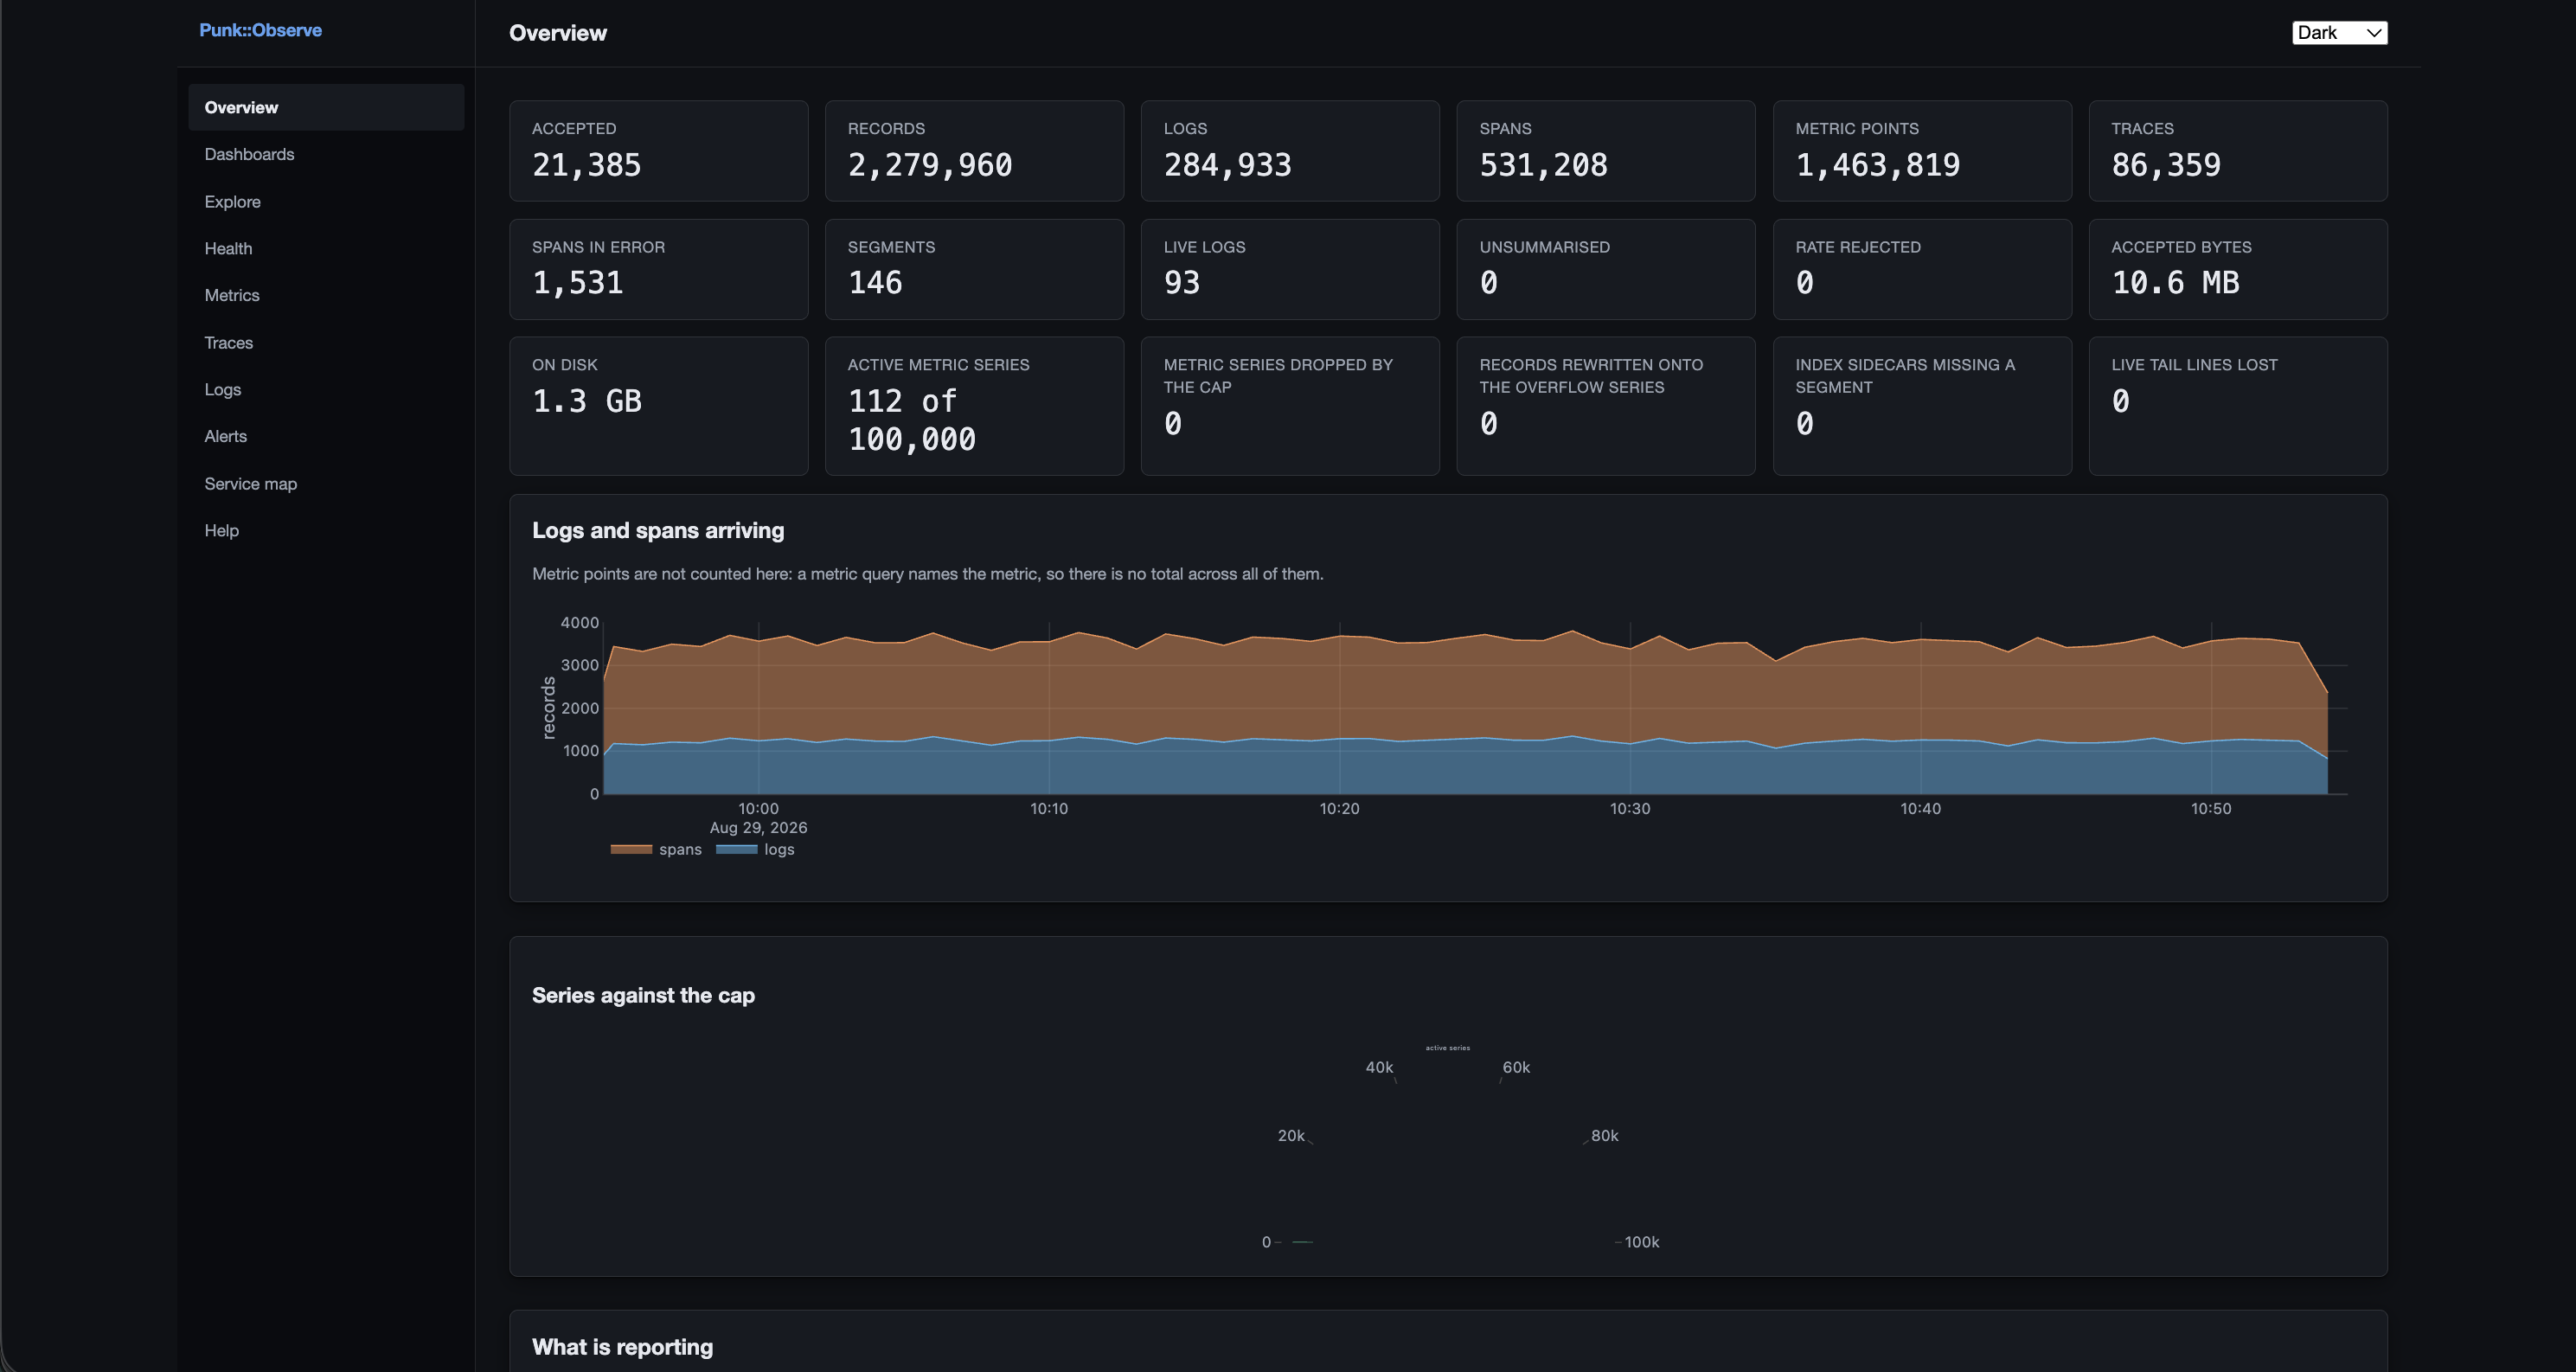
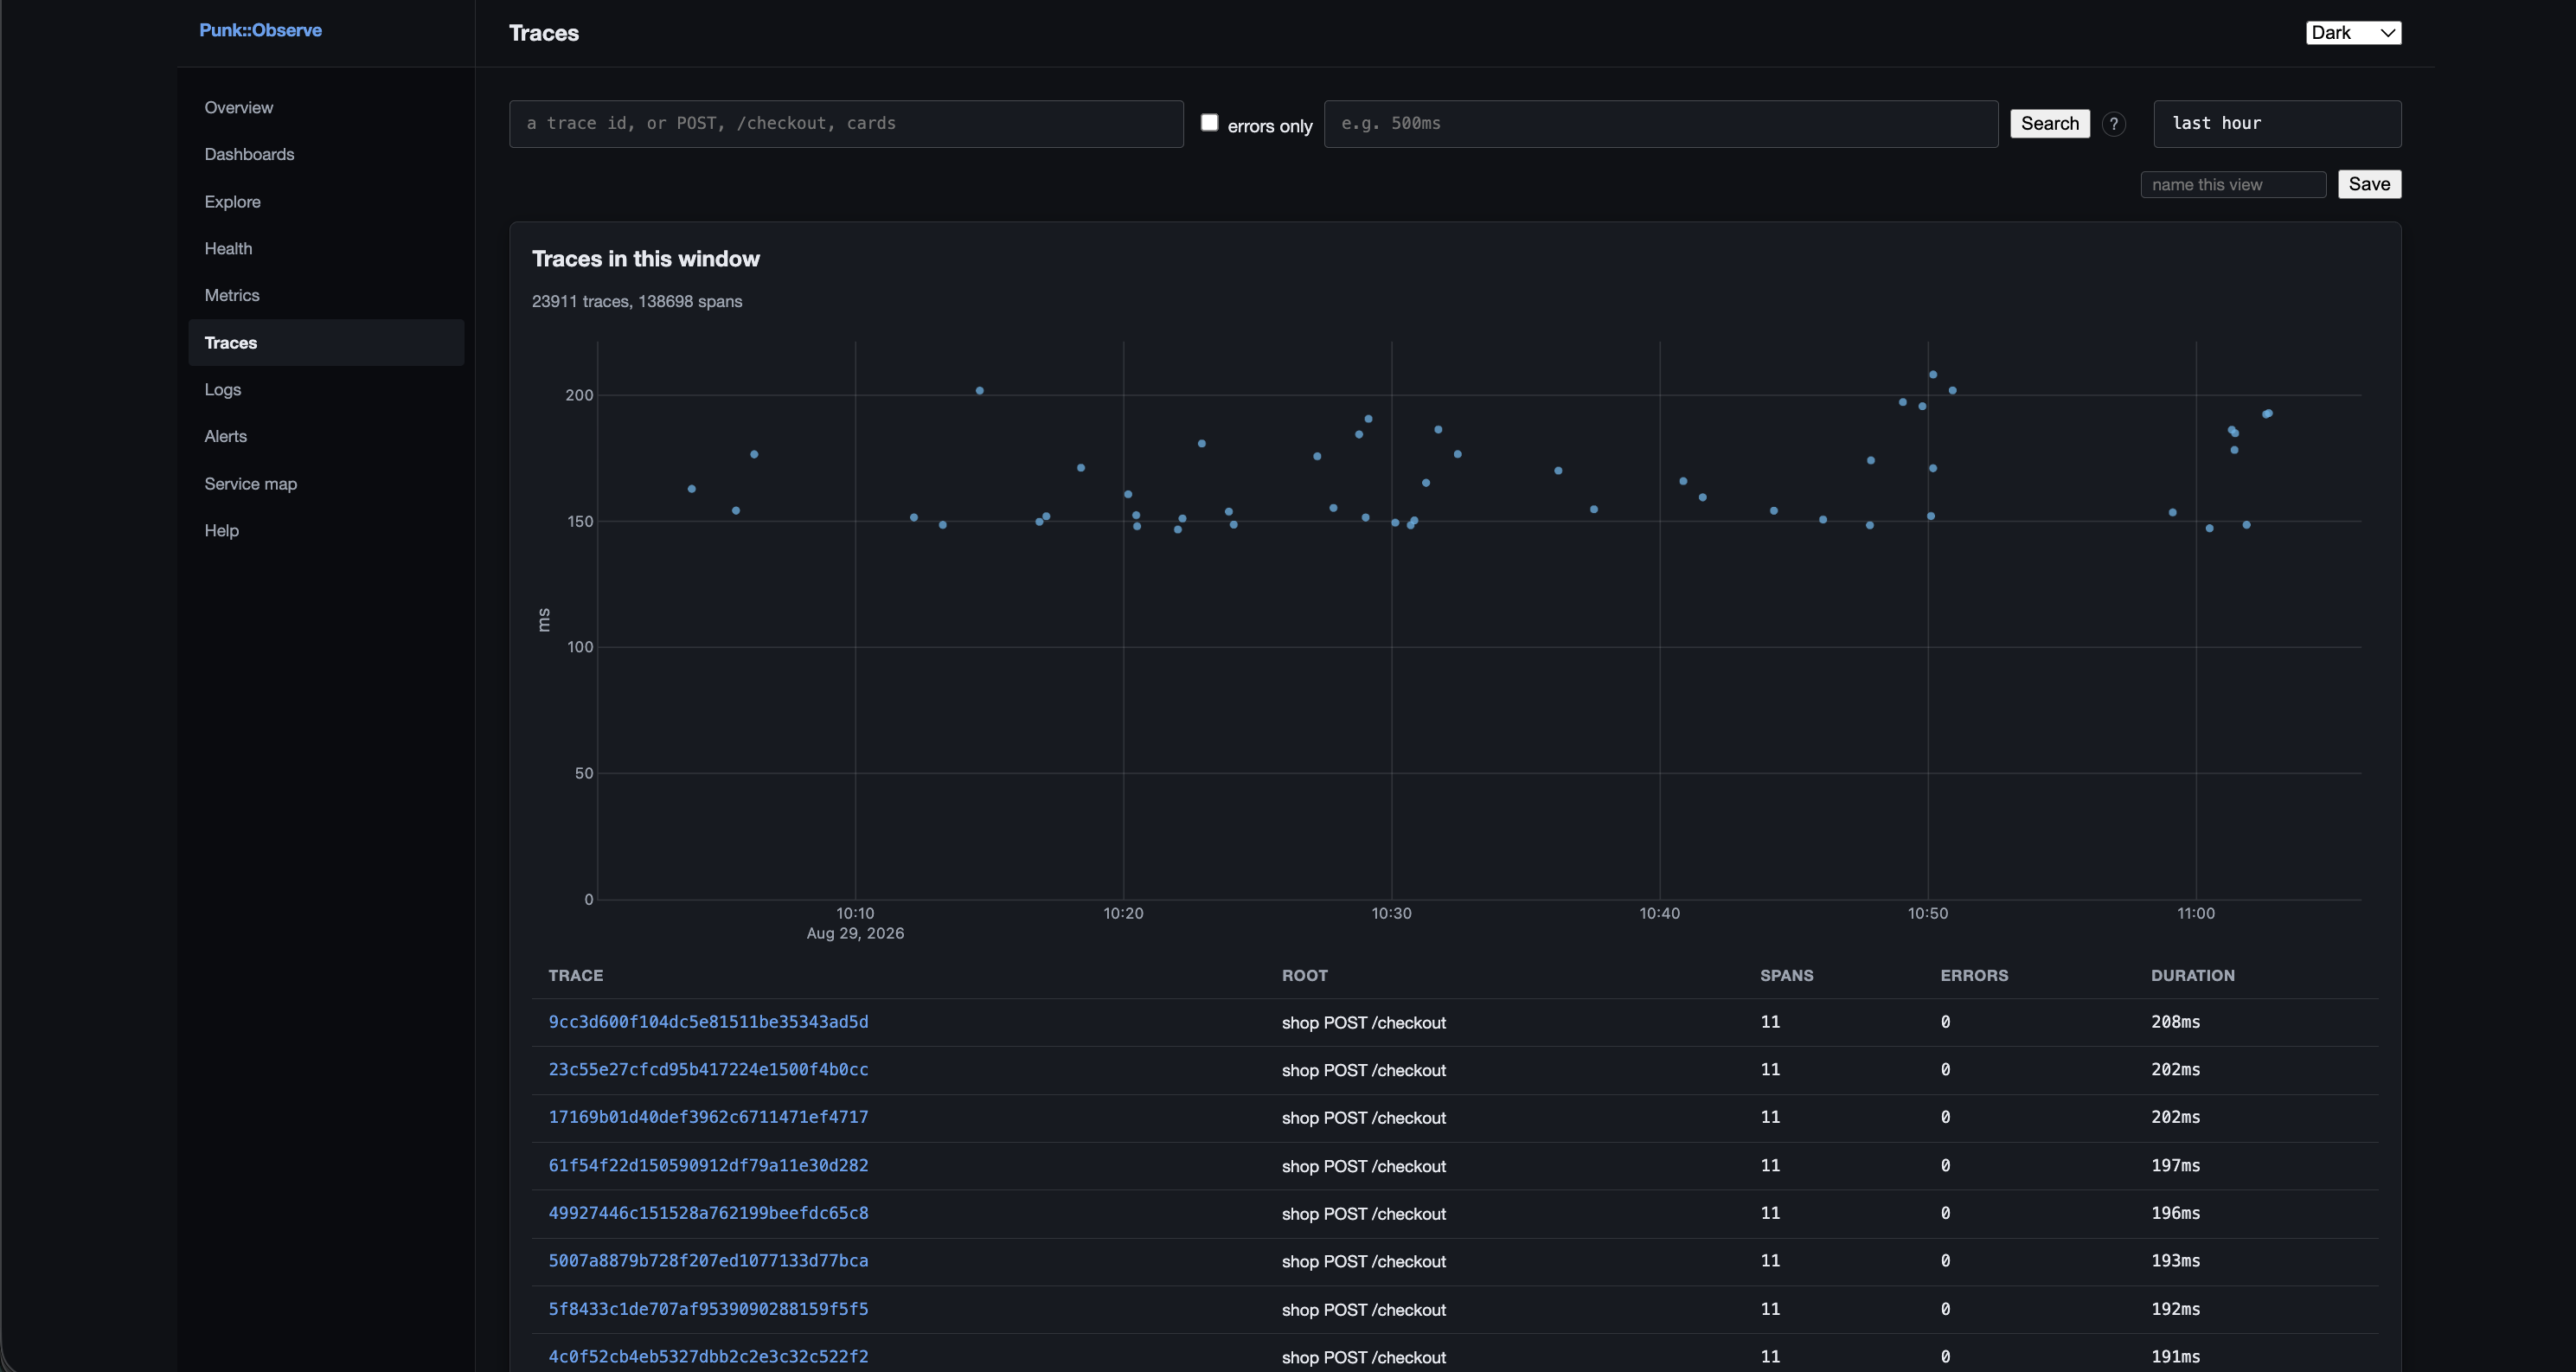
All of it served by the plugin, inside your application, wearing your guard. No second service to deploy and no dashboard tool to point at it.
What it is not
- Not a client If you want to emit telemetry from a Perl application, that is Punk::OpenTelemetry. This receives it.
- Not a server binary What ships is the engine, the receiver and the plugin, assembled by your application. There is nothing to supervise that you were not already supervising.
- No gRPC OTLP over HTTP is what the SDKs default to and what this speaks. One wire format kept correct beats two kept nearly.
- No clustering One writer, one box, local disk. Sharding would change the segment format, the compactor and the planner at once, against a workload nobody has measured.
Alert evaluation and delivery run as jobs on the host application’s Punk::Queue, so a queue worker has to exist - which any queue-using Punk application already has. Rules and dashboards live in a configuration database the plugin migrates.
Get it
cpanm Punk::Observe
Artistic License 2.0, like the rest of it. Needs Punk, and Punk::Queue for alerting. SQLite by default for the configuration database, Postgres when told.